Before we look at some of the reports LOU offers, it’s important to understand the difference between Reports and Analytics.
- Reports are defined as easily digestible, well-presented, existing data. In essence, Reports are structured data dumps. They don't analyze data, they simply display it.
- Analytics are reports that have taken that existing data and added meaning and value, creating new data which can be used to inform decisions. Pivot tables and Formulas are examples of analysis tools. Rather than simply displaying data, Analytics have analyzed data.
While LOU does have a handful of reports that qualify as analytics, the majority of LOU’s reports are data dumps/reports intended for you to customize and run analytics specific to your needs. You don’t have to export to run analytics, either! LOU provides many of the tools from Excel with which you are familiar right on the reports screen!
Ready to dive in? Let’s take a look!
When viewing reports that include Document Totals, Subtotals, and Taxes such as those on Estimates and Orders, the Tax Amount will only appear if you have previously clicked on the Estimate Taxes link on the Estimate or Order. If you have not clicked that link and you run a report, the Tax Amount will show as zero.
Taxes are finalized when you Invoice an Order, so any report displaying Totals for Invoices and Payments will include Tax information without having to click the Estimate Taxes link on the Document first.

Go to Operations / Reports / LOUs Reports 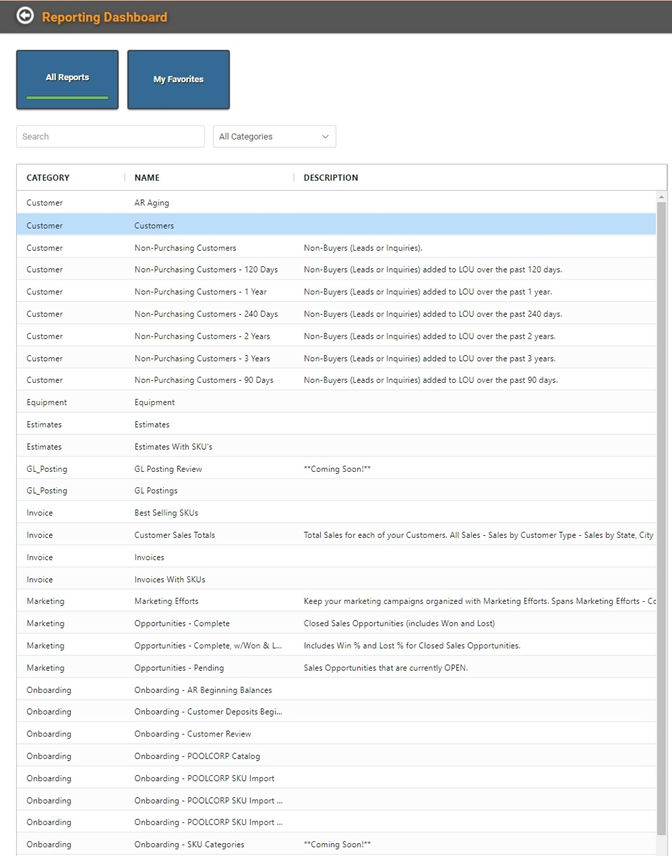
On the Reporting Dashboard, there are two tiles: All Reports and My Favorites.
All Reports
The reports listed are not every report LOU has. Instead, you are seeing the main report categories under which there may be several different templates.
- Categories: The general subject/data set of the report. Current Categories include Customers, Equipment, Estimates, GL Posting, Invoice, Marketing, Onboarding, Orders, Payment, POS, Purchase Orders, Recurring Orders, Schedule, SKUs, SKU Quantities, Stock Adjustments, Stock Transfers, Taxes, and Vendors.
- Template: The specific data pulled within that category. There are dozens of Templates within the Categories. Some Categories have well over 20 Templates to choose from!
To view a report, double-click the line item or hover over it and click the Actions link and select View Reports. If the report says **Coming Soon!**, don’t worry! We’re still working on it, but we’ll release it as soon as we can.
REMEMBER! Everyone is looking at LOU on different sized screens. Depending on your browser zoom and screen size, you may need to scroll to the right to see the Actions link. You can drag that column to the left, shortening the Description column, if you are having trouble. 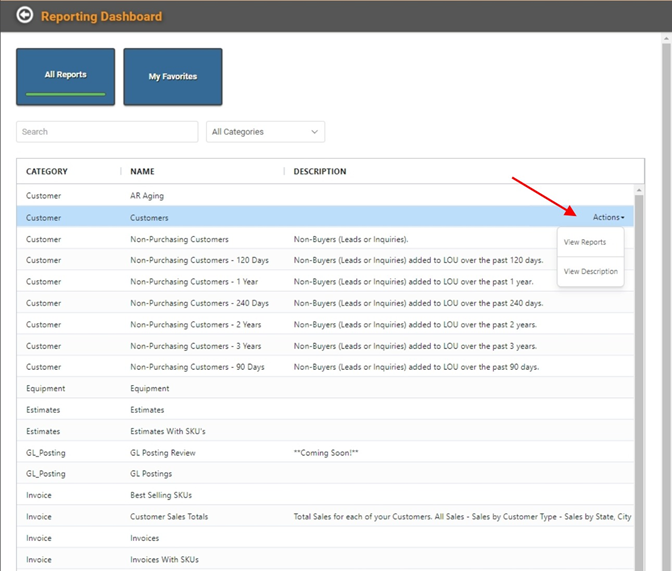
If the report requires a Date Range, a pop-up will ask you to enter those dates. Otherwise, you will land on the Report View Page. 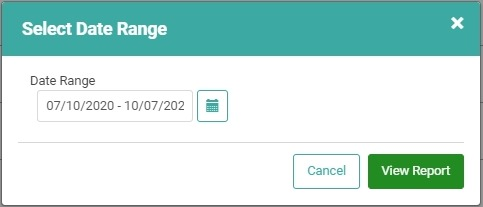
Once you’ve selected your Date Range, click  .
. 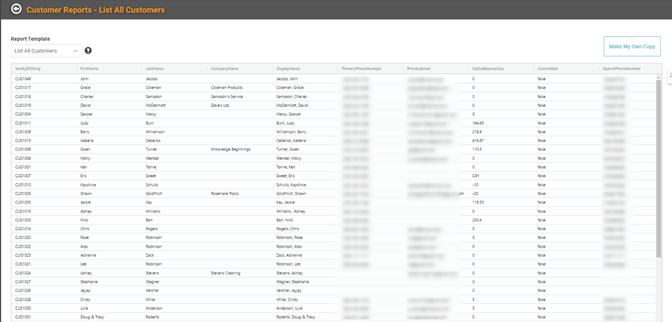
The report will generate in spreadsheet format.
Templates
You can select a different template in the same category by clicking the Report Template dropdown and choosing a different template. 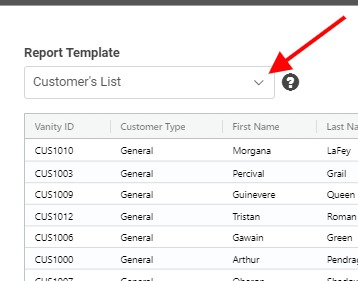

The templates allow you to look at slightly different reports in the same category. In this example, you can see the available Customer Templates include a Customer List, Customers by State, Customers by Type, and Customers with a Balance Due.
Customization and Analytics
You can hover over each column header to reveal a hamburger menu. Click the icon to expand the menu of actions you can take on each column in the report. 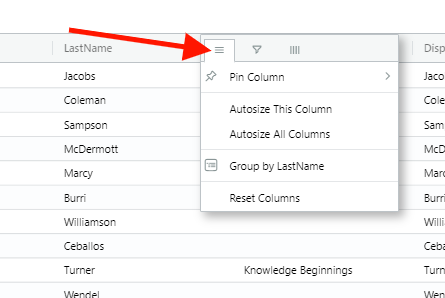
Next to the hamburger menu, there is a filter icon which allows you to create a filer for the report by the selected column. 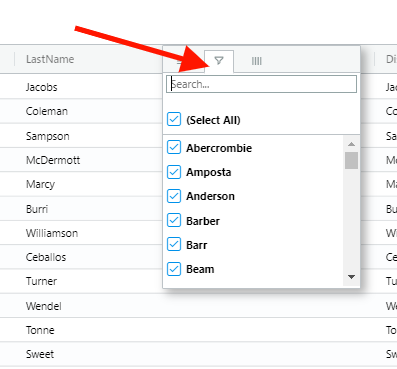
The third icon is the column menu, allowing you to select specific data columns you want to see on the report. 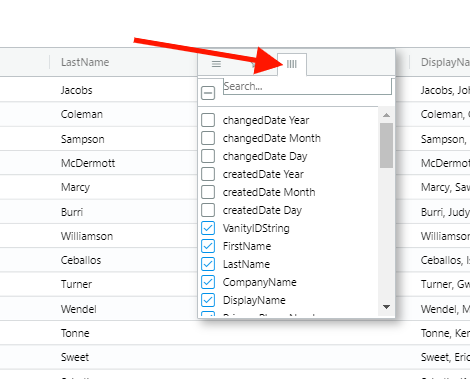
Each of these column action menus contains a search field so you can search for a specific action, filter option, or column header.
All the columns can be dragged to expand or shrink, to allow you to see more or less without scrolling OR to see more data within the column.
Additional Options
There are additional options available, including export options, by right-clicking anywhere in the report. 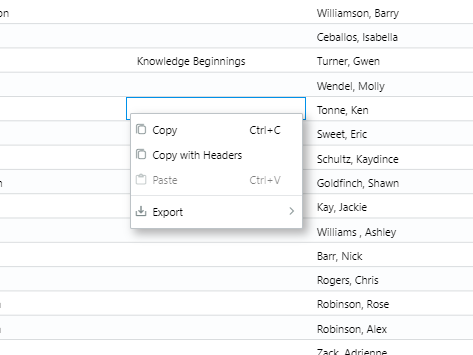
Export Reports
You can export a report out of LOU as either an Excel file or .csv. Right-click anywhere in the report and select Export and your file type.
IMPORTANT! Reports are limited to 5000 records that can be exported due to technology limitations. If you attempt to export more than 5000 records, you’ll receive an error. If you’ve selected a large date range for your report and you’re getting an error due to too many records, try running the report for smaller date ranges and combining in Excel. 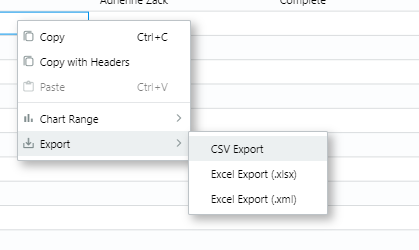
The file will download to your computer.
REMEMBER! Any of the formatting and manipulation you did in LOU before exporting will be maintained.
Full CSV
There are five reports we’ve identified as being the most critical to download all records more than 5000 records. For these reports and all their templates, there is a Full CSV Export button that will allow you to download a .csv file of your complete record list. This does not replace right-clicking and exporting 5000 records. This is a separate export option. 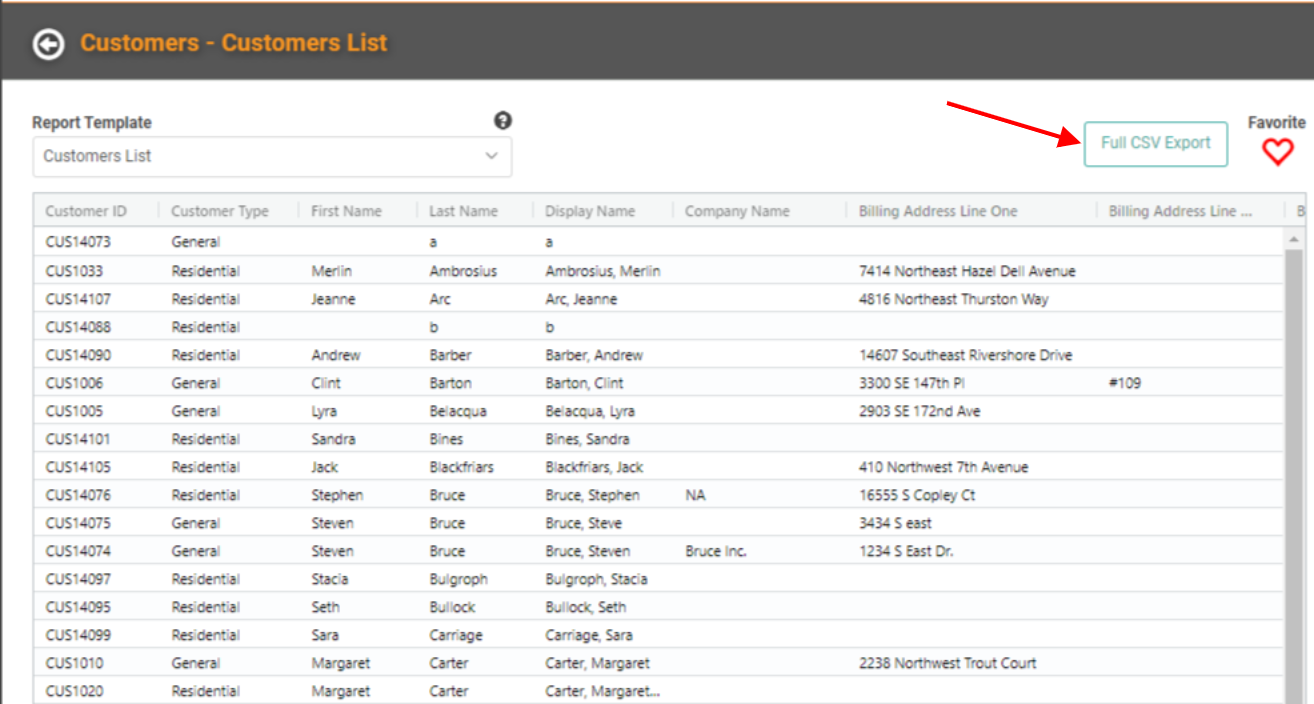
The five reports with this feature are:
- Customers
- Vendors
- SKUs
- Equipment
- GL Postings
Print Reports
Currently, there isn’t a way to print reports from inside LOU. However, you can print the report if you export it out to Excel first.
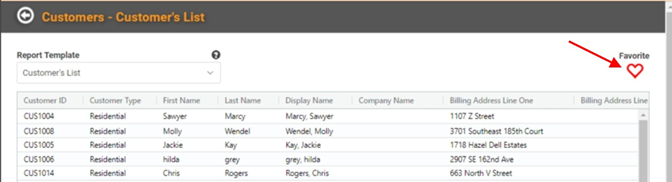
My Favorites
When viewing a report, you can click the heart on the upper right to Favorite that report. This adds the report to the My Favorites tile. My Favorites does not save customization and analytics, but it does allow you to quickly navigate to your most-run reports without having to scroll through All Reports every time.