The Revenue by Technician report gives you a summary of revenue generated by your Service Personnel. Hours charged for labor and SKUs added to Orders by Service Techs are included here.
This report is available in the LOU Analytics feature. This feature provides reports with digestible analytics and dynamic features that allow you to customize how you view the data being presented and schedule report downloads.
Data Calculations
This report using 3 points of data that are calculated by LOU. These are calculated as follows:
- Total $= Inventory Price + Labor Price. No tax is calculated in these amounts.
- Inventory %= Percentage of Revenue generated from Inventory SKUs
- Labor % = Percentage of Revenue generated from Labor SKUs

Go to Operations / Reports / LOU Analytics / Revenue By Technician
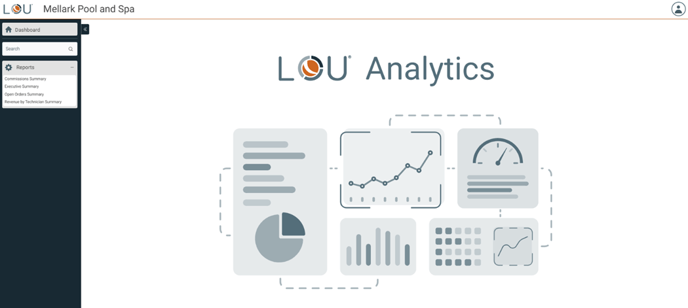
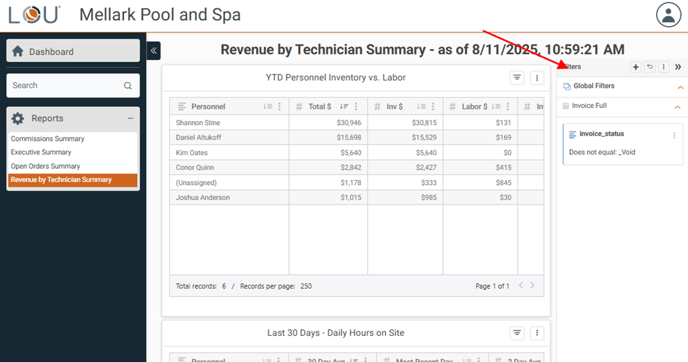
When you arrive at the LOU Analytics main dashboard, the available reports will appear on the menu on the left of the screen. Select the Revenue by Technician report.
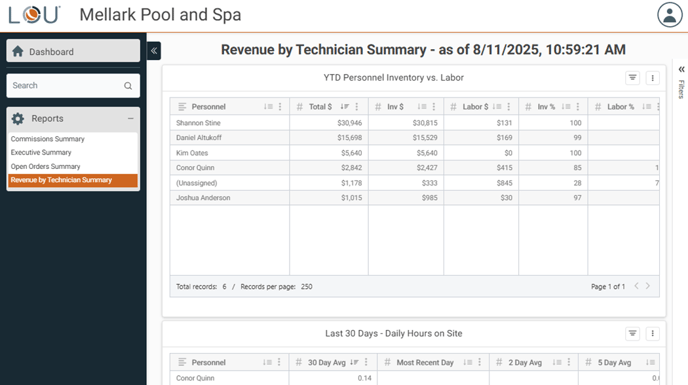
REMEMBER! All reports on LOU Analytics are updated every 4 hours. Since there are a lot of calculations and dynamic features being presented, this data cannot be updated in real time. You can quickly determine how fresh the data being presented is by viewing the Date and Time stamps along the top of the report dashboard.
The default dashboard view for the Revenue by Technician has three summary views:
- YTD Personnel Inventory vs Labor: This summary lists the total amount of revenue as a sum of Inventory SKU Prices and Labor SKU Prices generated by your Service Personnel year-to-date as well as what percentage of the total is represented by each SKU Type.
- Last 30 Days – Daily Hours on Site: This summary gives you the total hours spent onsite at a Task by Service Personnel in the last 30 days.
- This Total is calculated by looking at Check In and Check Out times on the LOU Schedule Mobile App
- Last 30 Days – Outcome Hours by Task Type: This summary gives you total hours logged on Work Order Outcomes, by Task Type, for the last 30 days.
- This Total is calculated by adding the recorded hours on Work Order Outcomes by Task Type rather than by Personnel.
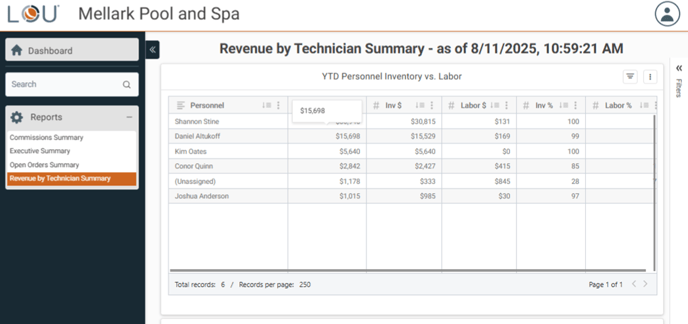
As you move your cursor around the screen, you will notice that there is additional information available for data points as your cursor lands on them. For most of the graphs, hovering over a particular bar or pie piece will give you an explanation of the data point. For column grid-column data, hovering over a data point will magnify that data.
Filter Data
There is a collapsible Filter menu on the right side of the screen.
When you click Filters, the Filter menu will open and allow you to filter the data you see on this dashboard.
In addition to this global Filter option, you can click the Filter icon on each dataset to filter just that dataset on the dashboard.
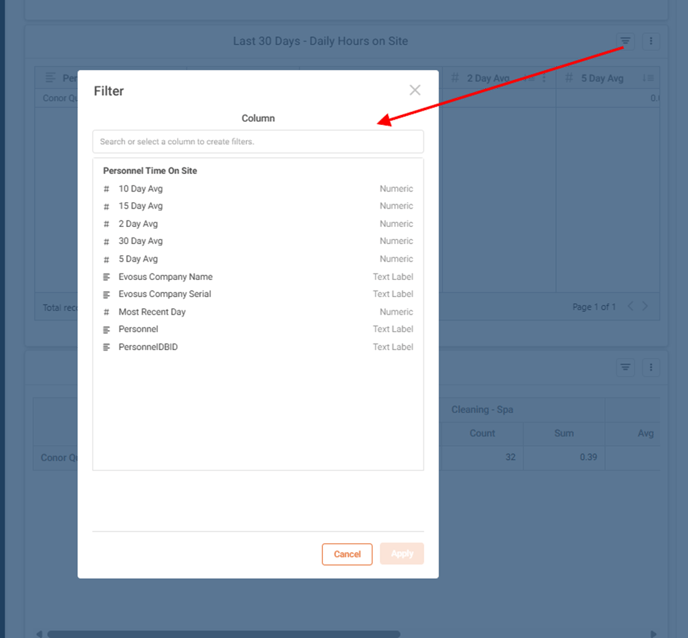
When you see the little dot on the Filter icon, that means there is already a filter applied to the graph. Click on the Filter icon to see what filters are already applied and add additional filters.
Download the Report
You can download the data by clicking on the kabob (3 vertical dots) menu on each dataset.
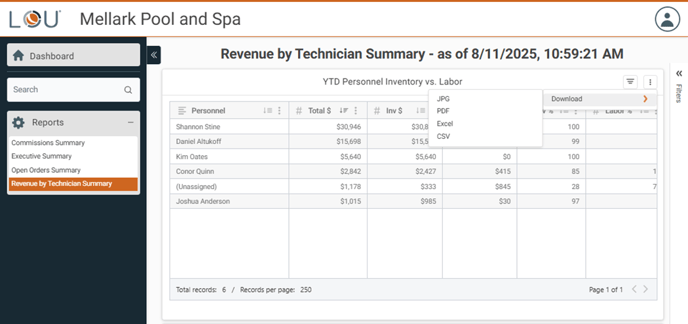
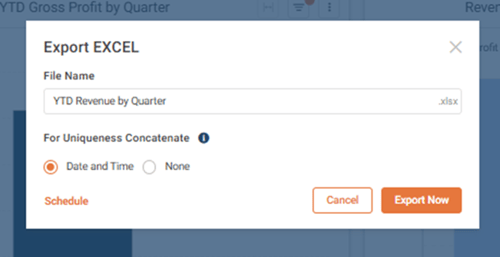
Choose whether to download as a JPEG, PDF, detailed spreadsheet in Excel or CSV, or a CSV-summary. Once you choose, you will be asked to give your download a name and determine if you want the date and time added to the file name.
Schedule the Download
Before you click Export Now, you can Schedule the download by clicking the Schedule link on the bottom left.
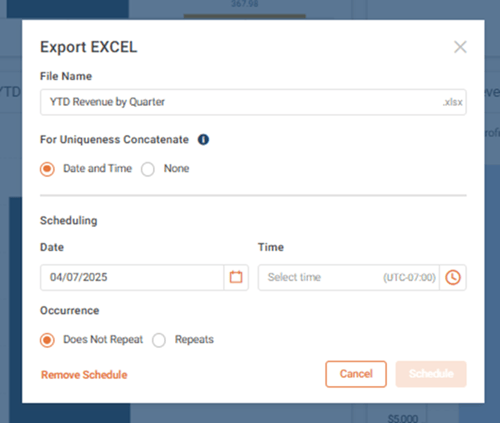
This will open scheduling controls that allow you to schedule the download for a specific date and time. You can create a recurrence for the report to download on a repeatable schedule. Toggle Repeats and determine the schedule.
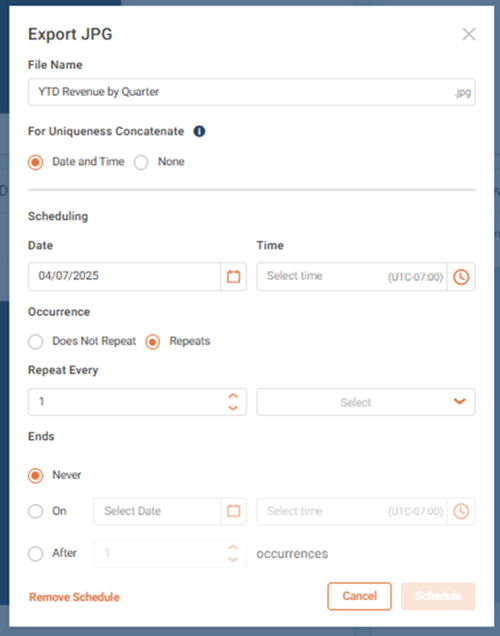
Once you’re satisfied with the settings for download click Schedule.
TIP! Use this schedule feature to ensure End of Month, End of Quarter, and End of Year reports are downloaded on time every time!
Go to Detail View
When you click on a data point, you can choose Go to Detail View to see a line-item detailed view of the report. This detailed view will break down the summary totals seen on the dashboard.
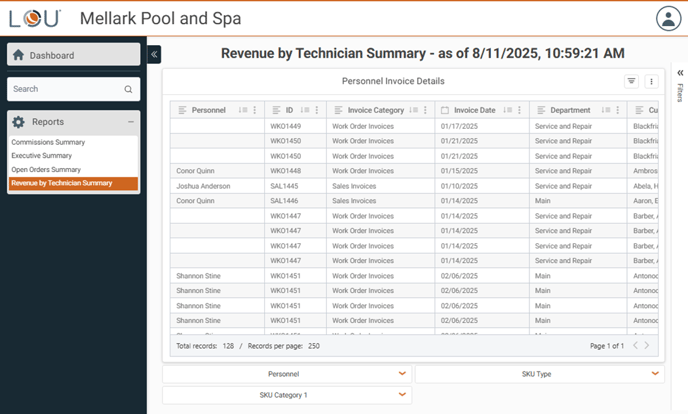
This detailed view can be filtered, sorted, and downloaded. You can click and drag columns around to reorder the data, certain data fields may be links to those data points within LOU.
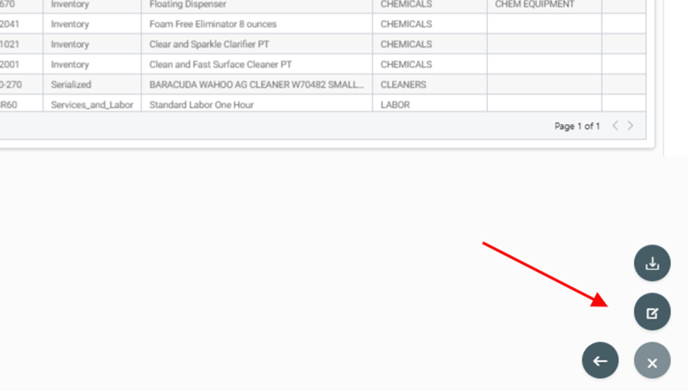
Additional Navigation
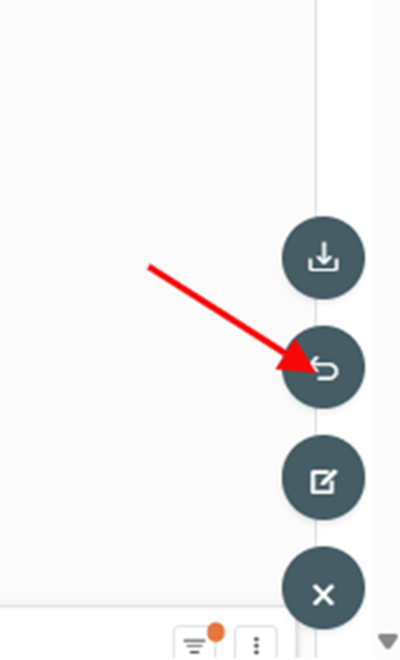
When viewing details, there are some additional navigation options on the bottom right. Click the kabob button to reveal Download and Edit Dashboard buttons. You can also click the Left Arrow button to return the report dashboard graph view.
Edit Dashboard
This button allows you to edit the dashboard for each report.
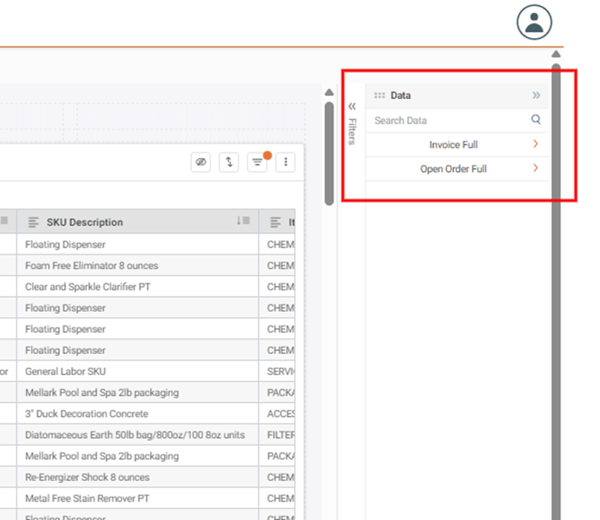
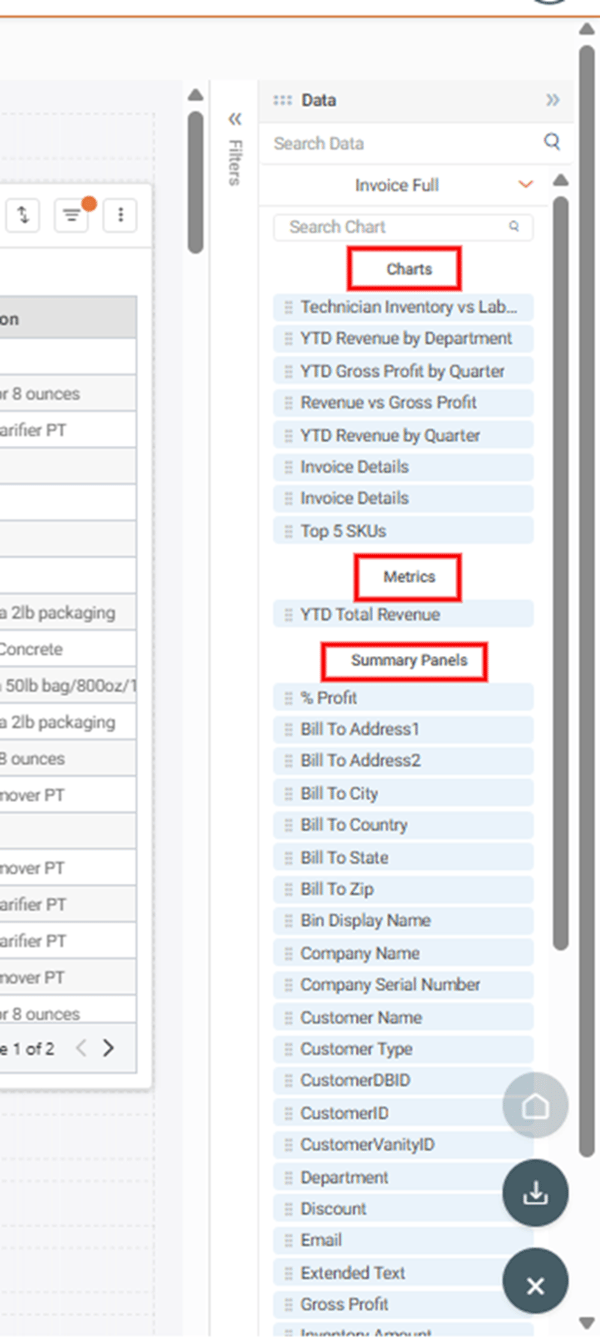
Click each line item to open the customizable datasets available on the dashboard for Charts, Metrics, and Summary Panels.
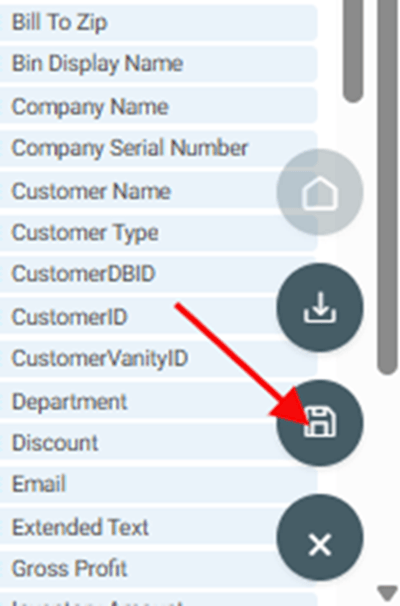
You can grab the data and drag it into position on the dashboard. Once you create the dashboard you want, use the Save button to save your changes.
You will be returned to the dashboard with the new edits in place. Changing this information will change the way the dashboards look when you access this report in LOU Analytics. If, at any time, you determine you don’t want those changes you can reset back to the default dashboard using the undo/reset button.