
The Money Tree Report is a powerful sales report that can provide a high-level overview of the health of your sales while allowing you to drill down to details. This report is not a financial report and should be used more as a sales tool. The Money Tree report should not be used to tie out to your General Ledger.
This report is designed to compare two periods of time, allowing you to view trends in sales over time.
Go to Operations / Reports / Money Tree
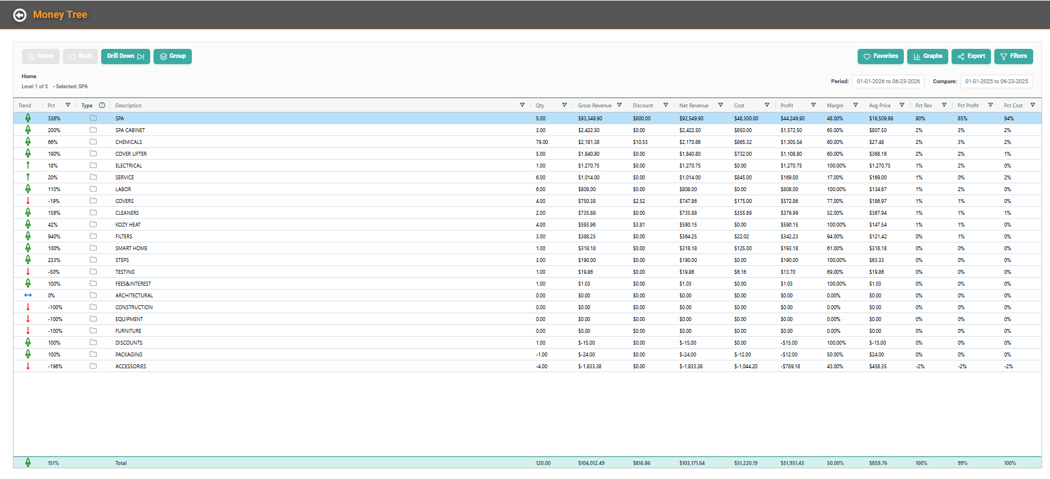
When you first arrive on the Money Tree report page, it may take a few moments to load the data. Once the data is loaded, though, navigating through the report and drilling down should be fairly fast. If you change the Date Range and comparison, it will take a few moments to recalculate and reload.
The report will show the top level, or Home. This is the high-level overview that defaults to SKU Categories. The initial Date Range will default to the current year, January 1st to Today, and the Compare Date Range will default to the same period of time in the previous year. The data presented on the report is from the Period Date Range as compared to the Compare Date Range.
You can change the Period and Compare Period by clicking in a Date Range. The Date Range Filters pop-up will allow you to make some selections on Dates and whether to include the SKU in addition to SKU Description on the report.
IMPORTANT! The greater the data set, the longer LOU will take to initially process and display the report. Multi-year comparisons will take longer than single year comparisons.
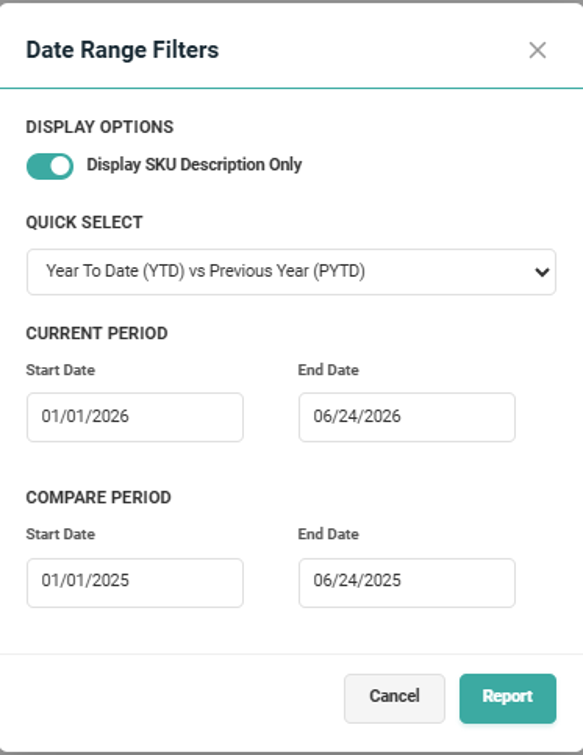
Toggle Display SKU Descriptions Only off if you want to see a column with the SKU as well. Keep in mind that the SKU ID will only display data on views that are at the SKU Level. When you are viewing a level other than the SKU level, this column will be empty.
The Quick Select dropdown offers 3 different comparison period structures: YTD vs Previous Year, YTD vs Previous 2 Years, and Custom which lets you determine the Period and Comparison Period ranges. Once that is selected, you can enter the Start and End Dates for both the Current Period and Comparison Period.
REMEMBER! You can enter any range of valid dates, including multiple years. However, LOU won’t allow you to compare future dates or overlapping periods.
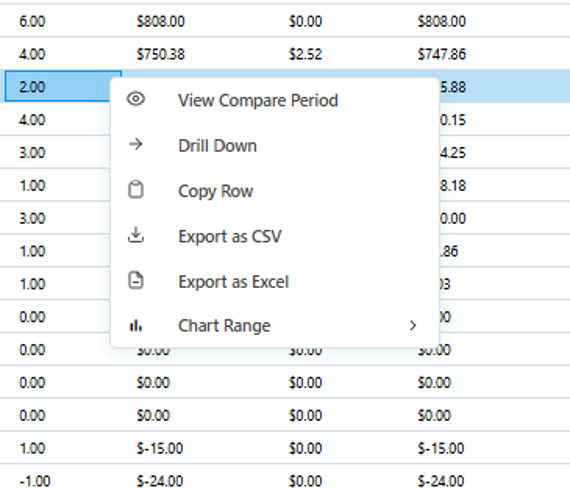
The buttons at the top will allow you to navigate, view a Graph of the data on the page, export the report to Excel, or filter. The individual columns of the report also have filtering and you can right-click anywhere in the data for additional actions you can take on the data.

Column Definitions
Let’s define the data on this report.
Trend Icons
These icons give you a quick visual on sales trends for the Period as compared to the Compare Date Range.
- Green diagonal up arrow: +1% to +10%
- Green vertical up arrow: +11% to +20%
- Red diagonal down arrow: -1% to -10%
- Red vertical down arrow: -11% and higher
- Blue side-to-side horizontal arrow: 0% change
- Green rocket ship: +21% and higher
Pct (Percentage)
This column is giving you the percentage increase or decrease for the Period as compared to the Compare Date Range.
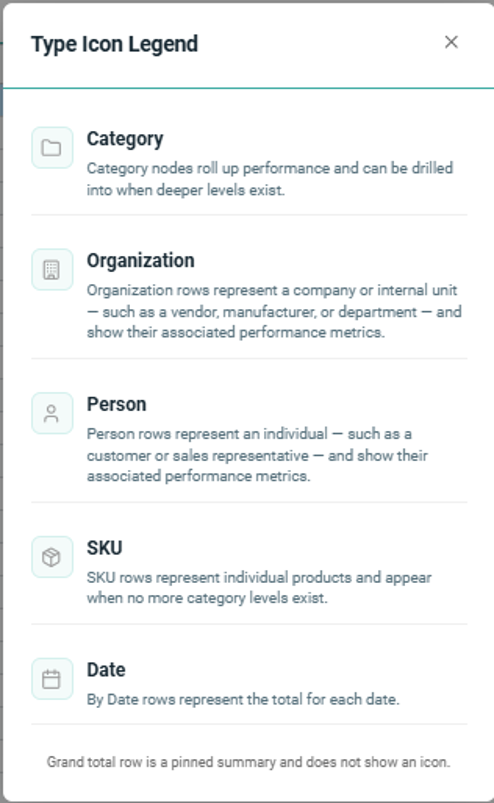
Type
These icons define what type of data you’re viewing. To view a key of the icons, click the question mark next to it.
Description
This is the Description for the data Type being shown. On the Home level, the data is SKU Categories, so the Description is the SKU Category Name.
Qty (Quantity)
How many items are represented on this line item. For SKU Categories, how many SKUs are in this category.
Gross Revenue
Total Amount received in sales for that item.
Discount
Discounts given for that line item.
Net Revenue
Gross Revenue minus Discount
Cost
Your Cost as tracked on the SKU Profile(s).
Profit
Net Revenue minus Cost
Margin
Gross Revenue minus Cost divided by Gross Revenue
Average Price
Sales Total divided by number of Sales
Percentage Revenue
Represents the percentage of the Total Revenue for which this line item is responsible.
Percentage Profit
Represents the percentage of the Total Profit for which this line item is responsible.
Percentage Cost
Represents the percentage of the Total Cost for which this line item is responsible.
Bottom of the Report
The numbers across the very bottom of the report represent the overall totals for each column.
Group
There are many different data sets which can be viewed on the report. The default, Home, is SKU Categories, but you can click the Group button to see the additional data sets available.
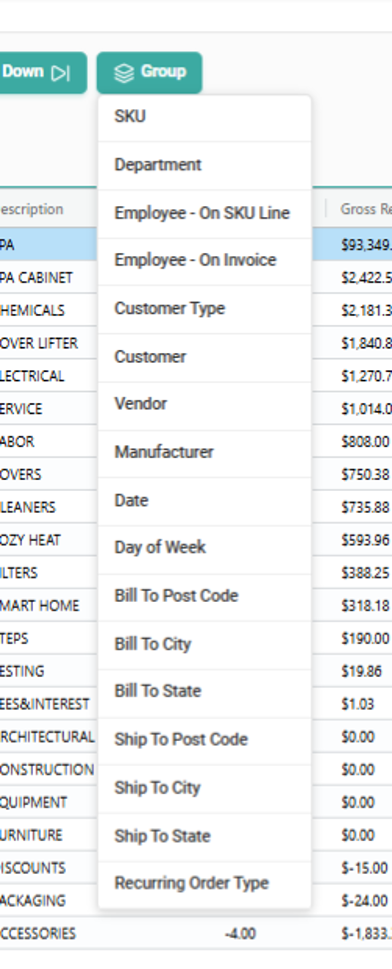
These data sets allow you to see sales comparisons by different categories. Viewing by SKU may be useful in determining what products to carry while viewing by Day of the Week may help you determine the best days to hold promotions.
When viewing by Employee – On SKU Line, SKUs the employee added to a transaction will display. When viewing by Employee – On Invoice, SKUs on an Invoice the employee created regardless of who may have added them to the Order will display.
Drill Down
The Drill Down button will allow you to drill down into the details of the selected Row.
For this example, from Home (SKU Category level – the highest overview) we selected the Spa SKU Category and clicked Drill Down.
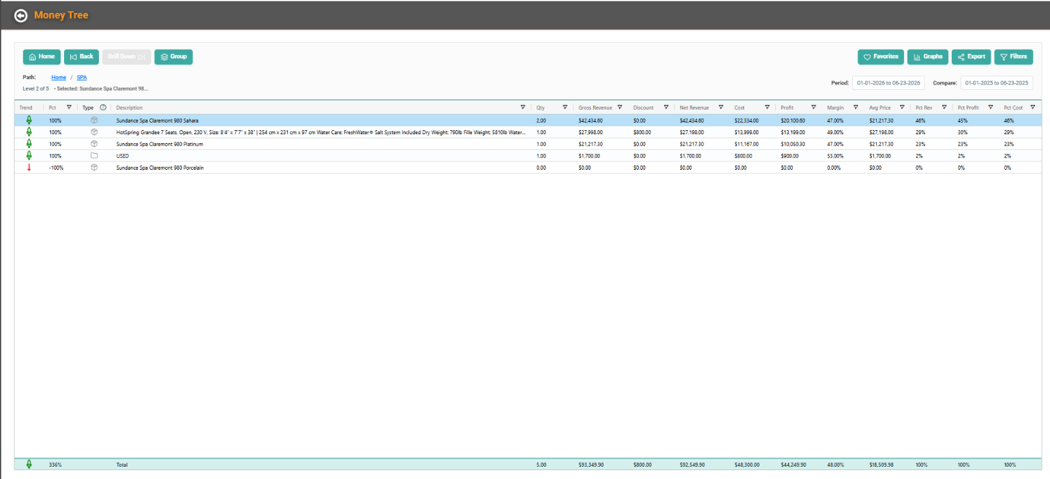
Now we are on the SKU level, Level 2. We can see the same sales overview data for each SKU within the SKU Category that we saw for the SKU Categories on the Home level.
Notice the Drill Down button is grayed out. The SKU level is the lowest level to which we can drill down for this data. However, there is still more data we can see from here.
Favorites
You can mark a report view/configuration as a Favorite and access those Favorites. This can save you time when you know there are views you often rely on.
REMEMBER! Once you have saved a view LOU won’t let you save it again, even if you change the name. This helps to keep your list of Favorites manageable and helpful.
Graphs
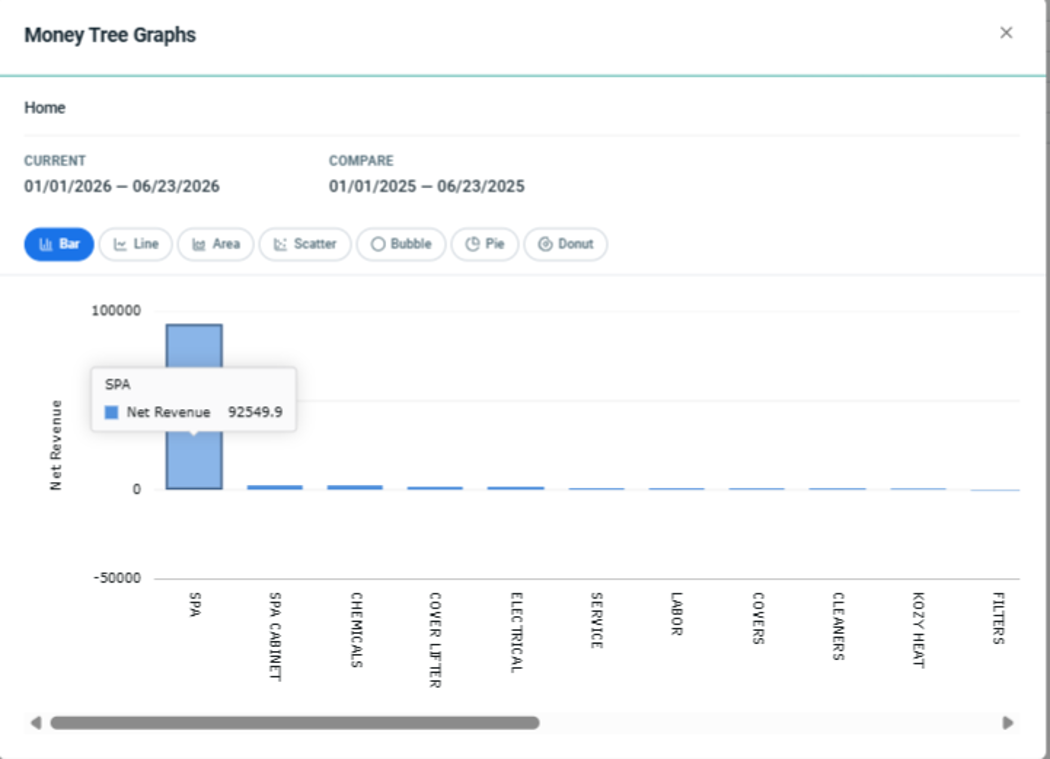
View graphs for the current report level.
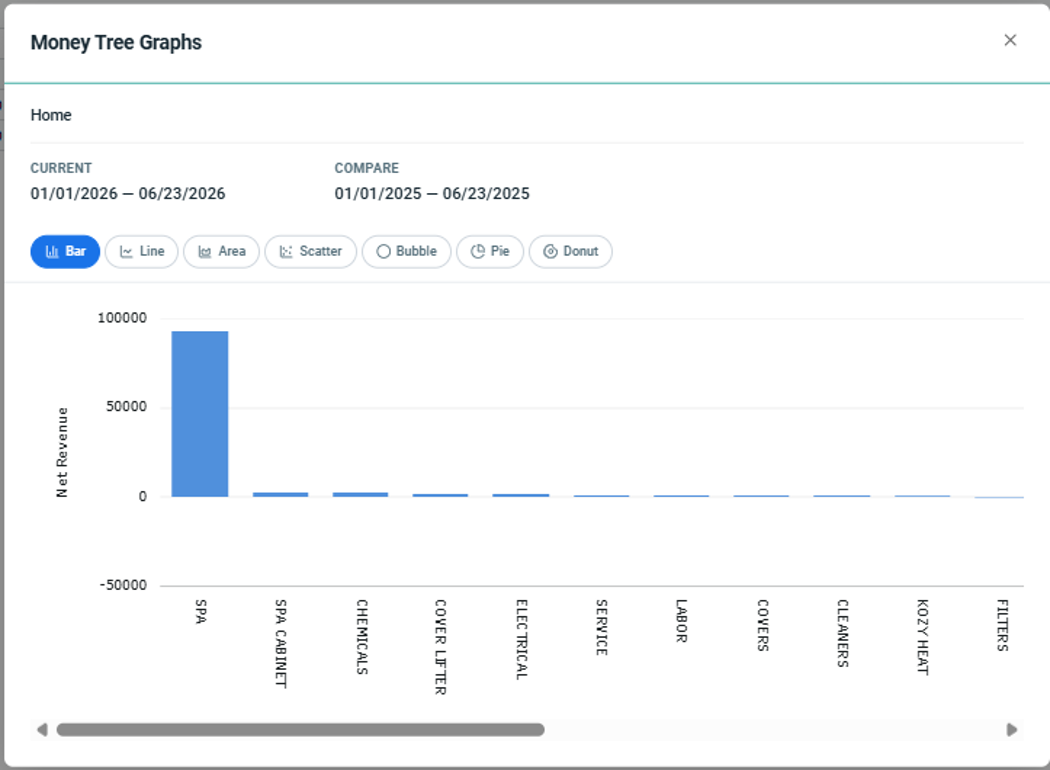
The default is a bar graph, but you can select from a range of other styles to see one that best displays the data for you. Hover over the data point to see specific information.
Export
Use the Export button to export a Customer List associated with this view or this report view as a pdf.
REMEMBER! You can also right-click anywhere in the data and choose to Export.
Filters
The Filters button gives you access to that Date Range filter as well as the option to clear all the filters and return to the default view.